I am in need of a complex chart for my client and I recently discovered EasyCharts ( http://www.objectplanet.com/easycharts/ ), a much touted charting applet, which seems to have complex charts just for my needs.
I have successfully gotten it to show up in Servoy 2.2.1rc3 but I can’t get it to change from the blank default it arrives with. I’m using sample code they provide on their website, and converting it to Servoy method language. Can anyone get me started, or over this first hurdle…
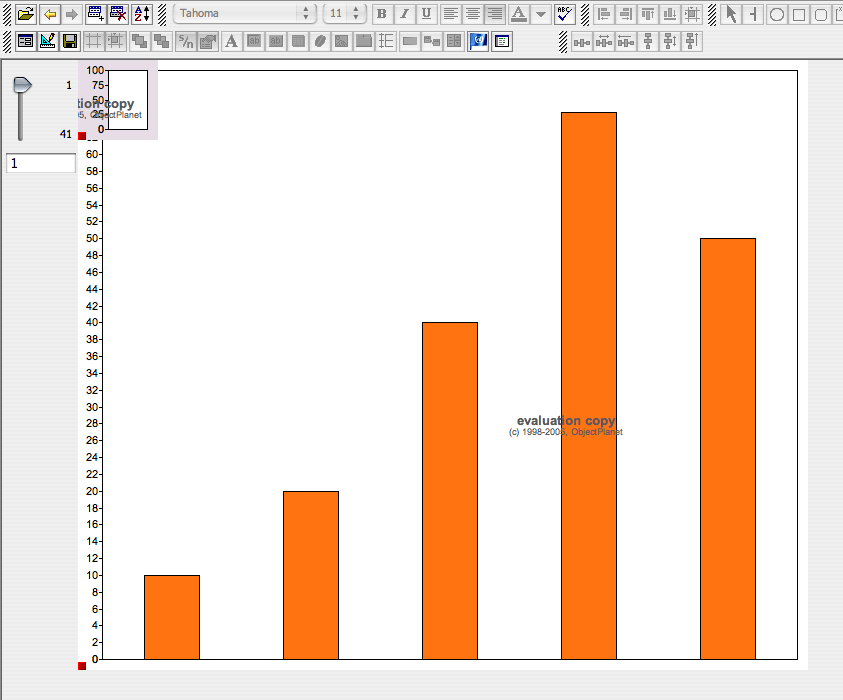
See attached – I got it to half work, but as you can see it appears I have two beans sitting on the form. Problem is, I don’t. I discovered that my method (posted above) was working when I resized the bean and saw orange bars below what appeared to be a foreground bean. I’ve deleted the bean several times and re-added it – just one. I tried creating a new form and adding this applet to it just once, and it does this.
I’m on a mac without Java 1.5 – could it be that? Where do i get Java 1.5 btw? Can’t find it on apple or sun’s website…
I’ve had some success with the EZ Charts demo libs.
I would double check with the Servoy guys, but placing an Applet in a form might be the cause of many problems. Obviously the demo version banner will go away with the real Easy Charts version, but the “doubled-up” look seems to be a problem with resizing the applet.
The trick is to add just the chart components as beans and not the Applets. The trouble is the chart components themselves do not automatically appear in the Insert Bean list. I checked the Manifest File for the EZ Chart jars and found that none of the classes are marked as being “Java-beans”. Therefore, Servoy doesn’t recognize them as such(and I don’t know why it sees applets as beans…).
I built another jar with my own manifest file and flagged all the chart classes as beans. Then I was able to add the various charts from the beans list. The strange display problem goes away. From the method editor you can still programatically manipulate their content and appearence. This also allows for direct method calls on the chart objects, circumventing the need for more cumbersome “setParameter” methods of the applets.
Hope this helps,
-Sean
Sean… it sounds like you’ve made this work – in EasyCharts, the exact software I need. Can we talk? I need to very quickly get a Complex Overlay Chart working in EasyCharts, and I don’t know how to write my own manifest file to make the charting components work with Servoy…
My email is ellen@meserow.com and I’d be really interested in talking further on this.
ellen
p.s. Servoy team still needs to look at the resize of an applet in 2.2.1rc3 no?
ellenmeserow:
p.s. Servoy team still needs to look at the resize of an applet in 2.2.1rc3 no?
Do you mean to anchor an applet/bean ?
I haven’t tried it with applets yet but with beans you anchor them by using the right-click (control-click for 1 button mouse on Mac OS X).
Then you get a menu to (de-)select the anchors.
then don’t place the Applet but the: BarChart on the form.
then use this code:
var values = new Array(10,20,40,65,50);
var c = new Array(new java.awt.Color(0xFF7310));
elements.cx.sampleCount = 5;
elements.cx.setSampleValues(0, values);
elements.cx.sampleColors = c;
elements.cx.background = java.awt.Color.white;
elements.cx.setRange(0, 70);
then it works.
I will check out why the applet with setParameters don’t work out of the box.
But do remember this is what we call a heavy weight component (awt) not a swing component. Those can cause drawing problems.
Johan,
I see that you can instantiate a new Color object in the method editor using one of its constructors. However, I tried to do the same with the BarChart using its construtor and the JS Compiler didn’t like it. My question is: Is it possible to call the contructor of any Java Class through from the method editor or does it work only for the libraries of the JRE?
If I wanted to use the overlay functionality of the chart app, I have to add two components to the form in order to get a reference to the chart bean objects in the method editor via forms.elements. But I do not want those input charts to be visible on the form. I just need to programmitcally manipulate them and add them to the overlay. Because they are components, I called setVisible(false) as a workaround. But is there a more elegant way?