Hi,
anyone had any joy in creating Gantt charts directly within Servoy.
I have looked at a few beans that do it, but I’m not an expert in how I would get them to work in Servoy as they don’t have a nice Servoy wrapper around them (the MiG Calendar bean does have a wrapper & does Gannt charts, but the wrapper doesn’t yet support the Gantt charts). I need it for a new solution, which also needs to be able to do Resource scheduling (basically I guess I need to implement something like a subset of M$ Project in Servoy…)
Thanks,
Rafi.
Yes, we also need some kind of graphic plan tool.
I hope Fred, has some time left, to implement it in his wrapper! ![]()
rafig:
Hi,
anyone had any joy in creating Gantt charts directly within Servoy.
I have looked at a few beans that do it, but I’m not an expert in how I would get them to work in Servoy as they don’t have a nice Servoy wrapper around them (the MiG Calendar bean does have a wrapper & does Gannt charts, but the wrapper doesn’t yet support the Gantt charts). I need it for a new solution, which also needs to be able to do Resource scheduling (basically I guess I need to implement something like a subset of M$ Project in Servoy…)
Thanks,
Rafi.
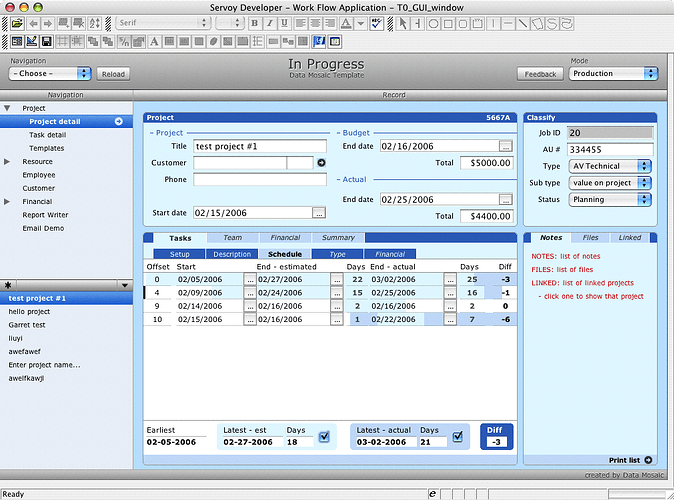
We’ve been messing around with Gantt like charts using just Servoy recently. Just takes a couple of calculations. Stlll some work to do – need to add day ticks along the header next. Figuring out the optimal html table formatting was the tricky part. Here’s the main display calc:
/*****
	- calculation returns an html table
	- set calc field the full width of a list view
******/

//flag to turn gantt on
if (globals.PRJ_gantt_task_actual) {

//set latest date
if (project_days_estimated > project_days_actual) {
	var total = project_days_estimated
}
else {
	var total = project_days_actual
}

/***** CHART NOTES ******
	- gantt chart is divided into three <td>:
		1) offset distance from earliest task date
		2) length of task
		3) remainder of time from end of task to latest task date
	- set to percentages to fill the width of any list form
*****/

var start = Math.floor((schedule_start_offset / total) * 100 )
var width = Math.floor(((schedule_actual + 1) / total) * 100)
var remainder = Math.floor(((total - schedule_start_offset - schedule_actual) / total) * 100)

if (width > 0) {

	return '<html><table width="100%" cellpadding="0"><tr>' +
			'<td width="' + start + '%" height="20"></td>' +
			'<td bgcolor="#bed7f7" width="' + width + '%"></td>' +
			'<td width="' + remainder + '%"></td></tr></table></html>'

}
}

else {
	return null
}
We have acquired the SchedulerBean from Fred this week.
Please have a look here Servoy Components – Plugins, Beans, Web Components, Angular Services & Servoy Developer Consulting for our press release.
We are in the process of renaming the bean and will release a new version as soon as possible. Whenever possible we would like to solve as many bugs as possible.
After that, one of the things we need ourselves is some sort of planning. So expect that to be available in the near future. However, I can not give a timeline yet!
Ciao
Unfortunately, the best-of-breed product in the desktop-price-range is probably Microsoft Project. However, there is the open-source alternative, OpenOffice.org. It does a rather neat job in its own right and supports MS Project compatibility.
If you were to consider using OpenOffice, then I could take a look at a native integration of the OpenOffice “Project” module.
Let me know if that suits.
Alternatively, if the scheduler bean does all that you need, then I would run with that.
The Calendar bean (new name ) will do it in the near future. No doubt!
I am rebuilding the bean to adopt all new features of the migcalendar bean.


