Hello
I’m playing with velecity report(Servoy 6.0.7)
I build a form with some test buttons and an html aera(dataprovider = form variable “vhtml”) to show the graphs.
Now i have some problems with the radar graph.
The code is from the velocity example solution (with a few label and legend changments)
var chartDef = {};
	chartDef.width = 600;
	chartDef.height = 500;

	chartDef.title = "Mitarbeiter Skills";
	chartDef.titleColor = '#ff0000';
	chartDef.titleSize = 20;
	//chartDef.spline = false;
	chartDef.areaFill = "#FFFFFF00";
	chartDef.radars = [
		{data: [40, 40, 50, 60, 80, 40], color: '#6633CC', legend: 'Progis',
			lineStyle: {lineThickness: 4}, fillAreaColor: '#6633CC33',
			markers: [{shape: 'circle', size: 12, color: '#6633CC'}, {shape: 'circle', size: 10, color: '#FFFFFF'}]},
 		{data: [80, 50, 50, 85, 60, 80], color: '#CC3366', legend: 'Techis',
				lineStyle: {lineThickness: 4}, fillAreaColor: '#CC336633',
				markers: [{shape: 'square', size: 12, color: '#CC3366'}, {shape: 'square', size: 10, color: '#FFFFFF'}]}
 	];

	chartDef.concentricAxis = {
		labels: ['0', '20', '40', '60', '80', '100'],
		style: {textColor: '#000000', fontSize: 12, alignment: 'left'}
	};
	chartDef.radialAxis = {
			labels: ['Englisch', 'Gehorsam', 'IT Kenne', 'Hardware', 'Datenbanken'],
			style: {textColor: '#000000', fontSize: 12}
	};

	chartDef.transparency = 100;
	var chartImg = plugins.VelocityReport.getChart(CHART.RADAR,chartDef);
	vgraph = '<html><body style="width: 100%; height: 100%; text-align: center; vertical-align: center">'+chartImg+'</body></html>';
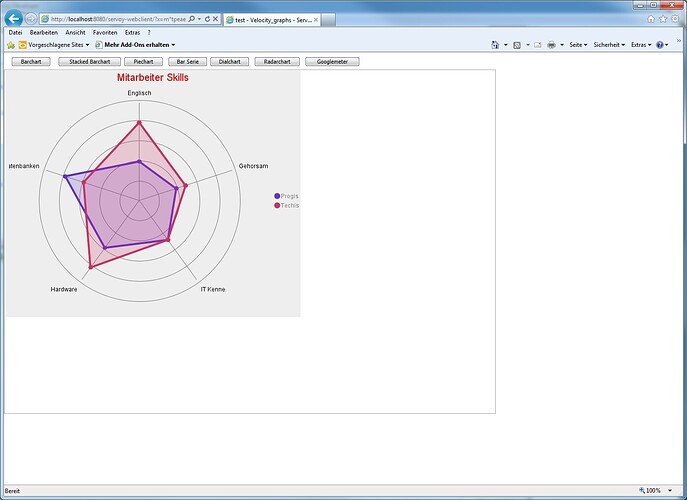
The labels are not shown ???
I can’t set form width to a value greater than 600 ???
See attached screenshot.
[attachment=0]screenshot1.jpg[/attachment]
What do i miss ??
Best regards
Albert
