I work on a Servoy system which, among other things, process a high volume of UDP packets using the UDP plugin running under a Batch Processor. In the Performance Data page I am seeing huge numbers of Refresh/Rollbacks - over 23,000 in just one day - and I don’t understand why. Thankfully they don’t seem to eat up a lot of CPU time - total time is just 20 secs for all 23,000 occurences. But it doesn’t seem right. Is this normal behavior?
The only commands I can think of that could be causing Refresh/Rollback are:
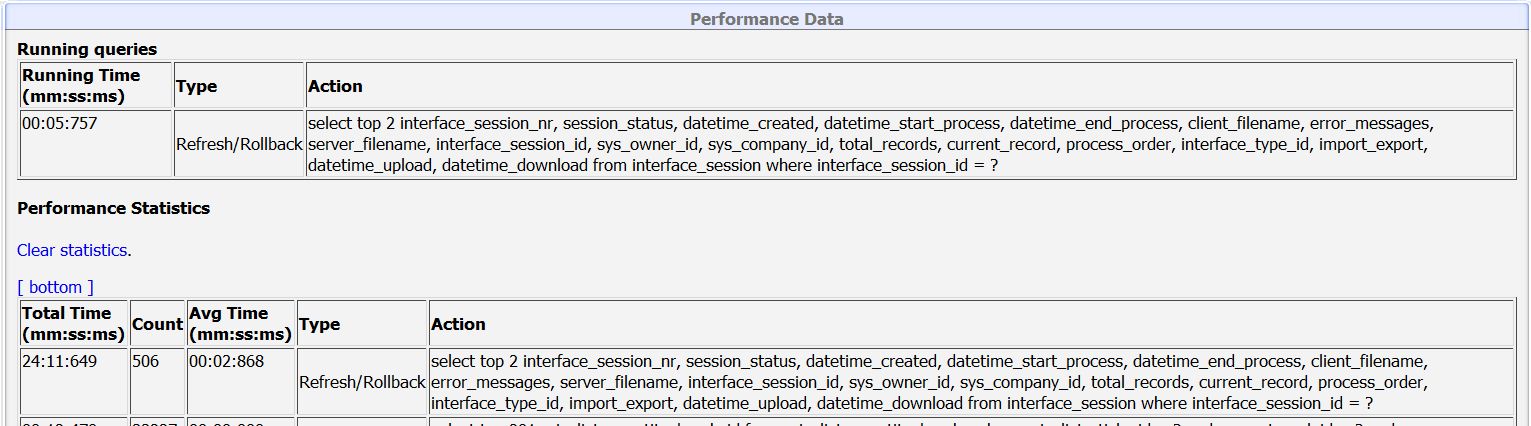
The query that appears in the Performance Data log next to ‘Refresh/Rollback’ is a “SELECT … on table where pk = ?” I have searched my code and nowhere am I doing any of those commands on that table.
Are there other things that can cause Refresh/Rollbacks? Any advice is much appreciated.
are you using transactions?
Because that looks like a a query that just takes 1 row of data from a table based on its pk.
That should be very fast.
Except if it just waits for it because another has a open transaction on that table.
Which database is this?
If it is sybase you should be able to see which locks there are.
It is SQL Server 2008 / Windows 2008 server / Java 6 update 20 / Servoy 5.1.4
jcompagner:
Because that looks like a a query that just takes 1 row of data from a table based on its pk.
That should be very fast.
Yes it should be indeed fast. But the record is updated very often. It processes a XML file and for each transaction the current record counter is increased. So lot of updates on the same record
jcompagner:
Except if it just waits for it because another has a open transaction on that table.
Then it probably waits for itself, because there were no other users
I also noticed that on Servoy 4.1.6 I didn’t see this message, and it looks like 4.1.6 is also faster.
Could it also be that this occurs because the current record counter is not being retrieved again, after COMMIT to the database has been done? The next transaction uses the same foundset.
Maybe that the databroadcasting can not handle this?
What happens with a foundset in Servoy when using a foundset in multiple transactions, containing both COMMIT and ROLLBACKs, like the following case:
read session record into foundset
start transaction 1
several updates in database
update session record (incl saveData())
commit transaction 1
start transaction 2
several updates in database
rollback transaction 2
start transaction 3
update session record (adjust errormessage to errormessages column) (incl saveData())
commit transaction 3
start transaction 4
several updates in database
update session record (incl saveData())
commit transaction 4
start transaction 5
update session record (status status to completed) (incl saveData())
commit transaction 5
It is a headless client and I checked the CPU time on the server. The JAVA-process of the application server took average 7% of the CPU-time.
That is not much, I would expect lot more for a headless client processing huge XML-files.
So I think there is also some delay (SQL Server, harddisk ?)
Even in my development environment with smaller server, it performs better (the process took 2 hours in development and > 4 hours on the production server)
the only thing is if you really only have 1 client doing something so there is really 1 transaction at anytime
And only 1 client updates records or rollbacks records then this shouldnt really happen.
that refresh/rollback is not only called for when you do rollback, also when a client A change the data of 1 row.
then another client B will ask for that record in that same refresh query. So if at that time client A already has a transaction on that table again, client B will wait for that.
I remember that I had on another client a view on that same record so that I could see the counter increasing.
Could it be that this refresh is in fact the databroadcasting?
And that in this case, the counter changes that much, that the databroadcasting has some difficulty to handle these changes.
That explains perhaps the Refresh (databroadcasting of the client)